Optimizing TypeScript Memory Usage
— 12 min# Update (2020-02-28)
The recording of my talk is online:
Also, my PR was merged a few week ago! Motivated by that, I created two followups, and I plan to write another post on one of those, so watch closely.
Since quite some time, I have been completely sold on TypeScript, though the typechecker itself can be very slow sometimes.
At my previous job, we had a huge TS project, with more than 4.000 files, which took roughly 30 seconds to check. But the worst problem was, that it was running very close to the node memory limit, and would frequently just go out of memory.
That problem was even worse when running tsserver in combination with tslint,
which would crash due to OOM every few minutes, as I already wrote about
in a previous post.
Well, since one of the more recent VSCode updates, it is possible to
increase the memory limit
of tsserver, which would have saved my life back then.
At some point, all this got too unbearable, and I started profiling and looking deeper into how things worked. In the end, I was able to save up to 6~8% of memory usage with a very trivial change.
Let me take you on a journey of what I did to achieve these improvements.
# Creating a reduced testcase
Demonstrating this with a 4.000 file project is not really feasible, but luckily, we can reduce this to a very simple testcase.
> npm i typescript @types/node
Throughout this post, I will be using versions
typescript@3.7.4 and @types/node@13.1.4, the most recent versions at
the time. My tsconfig.json looks like this:
{
  "compilerOptions": {
    "diagnostics": true,
    "noEmit": true,

    "strict": true,

    "target": "ES2020",
    "lib": ["ESNext"],
    "moduleResolution": "Node",
    "module": "ESNext"
  }
}
Very basic stuff. Using the latest lib version and target, with node modules, and without generating any emit output.
The diagnostics option is the same as if you would use it on the command line
with tsc --diagnostics, just a convenient shortcut, because I always find the
infos useful.
And then just create an empty file:
> touch index.ts
Running tsc now gives us some (abbreviated) output:
> tsc
Files:           82
Lines:        22223
Memory used: 61029K
Total time:   1.28s
You can use the command line option tsc --listFiles to find out what those
82 files are. Hint: it is just all the ts internal lib files,
plus all of @types/node.
Ok, so far this is not really interesting, lets extend our testcase a little bit:
> npm i aws-sdk
> echo 'export * from "aws-sdk";' > index.ts
(Note: This just installed aws-sdk@2.598.0 which btw is 48M on disk)
Lets run tsc again:
> tsc
Files:           345
Lines:        396419
Nodes:       1178724
Identifiers:  432925
Memory used: 465145K
Parse time:    2.38s
Bind time:     0.78s
Check time:    2.22s
Total time:    5.38s
Say whaaaaaat?¿?¿ Adding a single dependency adds a whooping 400M of memory usage and roughly 4 seconds of runtime.
I will let you in on a little secret: tsc is actually typechecking all of
the aws-sdk, which can be slow. We can avoid that by using --skipLibCheck,
which is recommended all over the internet to speed up tsc:
> tsc --skipLibCheck
Memory used: 375234K
Parse time:    2.28s
Bind time:     0.77s
Check time:    0.00s
Total time:    3.05s
Not that much of an improvement, but we got rid of the check time, and about
~100M of memory usage.
# Lets start profiling
In order to find out where all of this memory usage is coming from, we need to start profiling. Luckily, the node docs are quite good. Take a minute to read that page.
So, from now on, we will start tsc like this:
node --inspect-brk node_modules/.bin/tsc --skipLibCheck.
And I will be using chromium, navigate to chrome://inspect and wait for my
node process to appear.
Once the debugger is attached, we can resume execution
(the --inspect-brk switch actually suspends execution). We watch our console
in the background, and once we get the --diagnostics output, tsc is basically
done, but it still holds on to its memory.
Now we can switch to the Memory tab, and take a heap snapshot. This will take
a while. In my opinion, the
documentation
for this tool could be a lot better, but it gives you the very basics.
For someone who has never before seen this, this might be a bit overwhelming and confusing. And well, yes, it is. Memory profiling is actually a lot about intuition, and digging deeper into things.
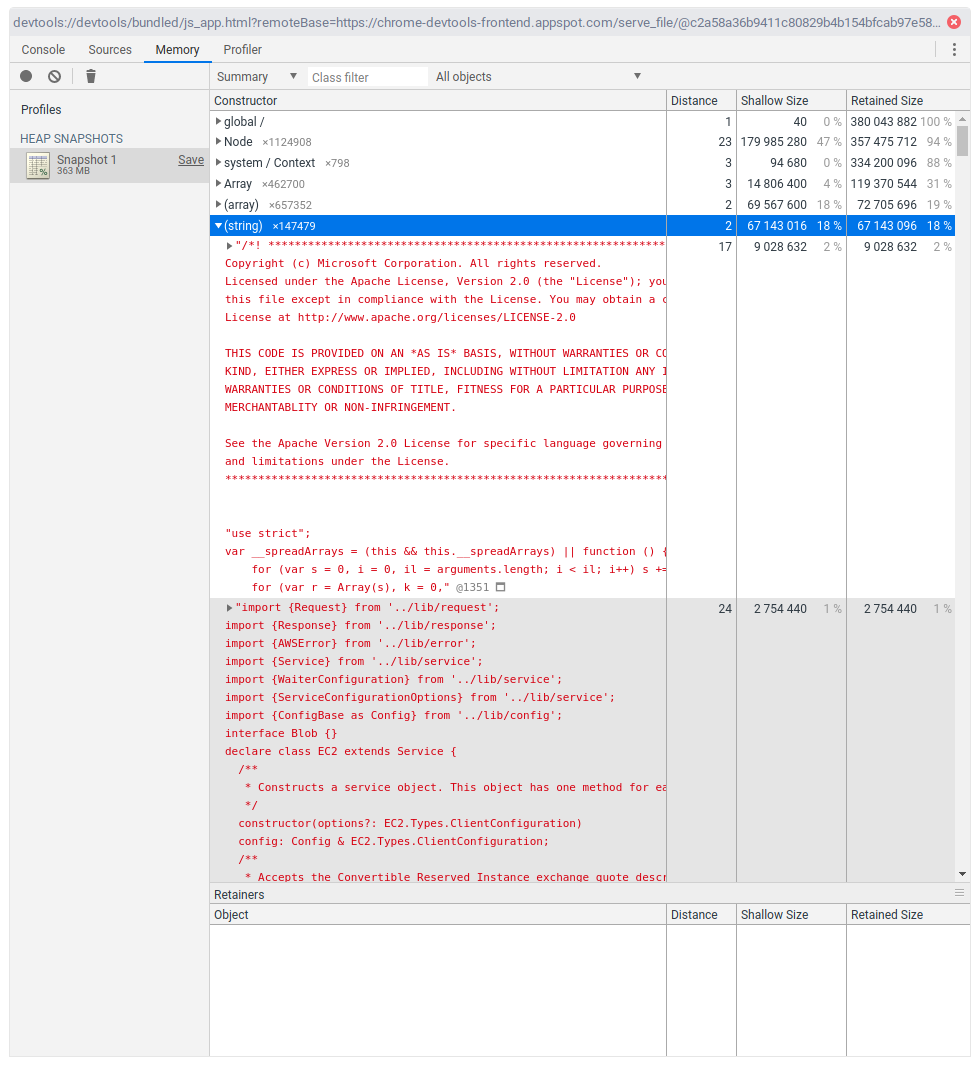
I have expanded the (string) category. We see 9M for tsc itself, and
then a number of files which look very much like the sources of the aws-sdk,
for a total of 67M. tsc essentially reads all the source files of aws-sdk
and keeps them in-memory. According to our --diagnostics output, that is roughly
~250 files, and the complete aws-sdk is roughly 48M on disk, so the
numbers start to add up.
Moving on, lets expand the Node:
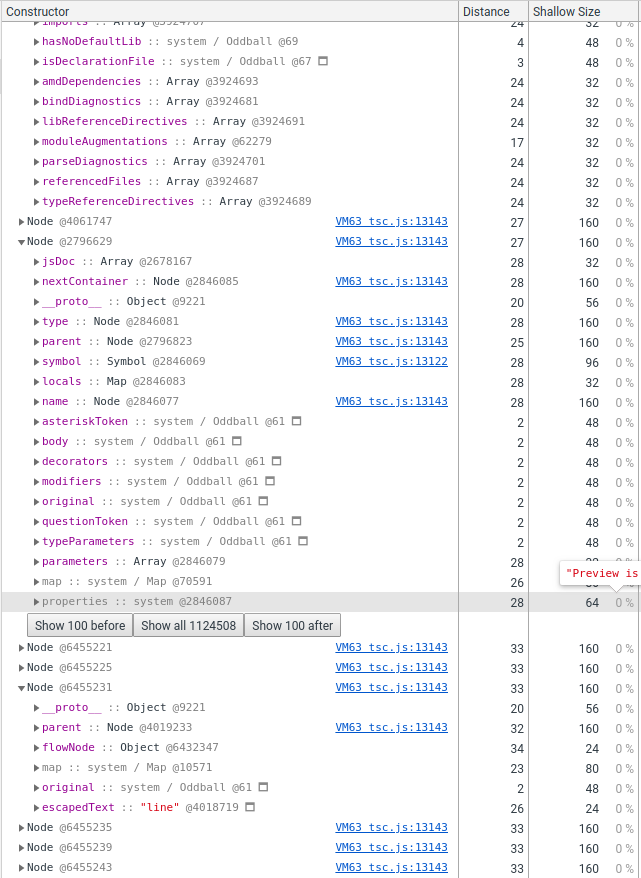
Here we see that each of the nodes is 160 bytes, and both according to the
memory profiler, and the tsc --diagnostics output, we have a bit more than
1 million Nodes, which adds up to almost 180M of memory.
Expanding some Nodes, we also see that the Nodes have very different
properties on them. One very relevant detail is also that not every property is
shown, more on that later.
# Diving into some theory
To progress further, we need to know a little bit about how v8 manages its memory. Luckily, the v8 team talks quite a bit about this and other performance relevant topics. Go and read one of the very good posts on the v8 blog, or watch one of the recordings from various conferences.
Also note that this is specific to v8, and other JS engines are different, though surprisingly still quite similar. Also, I might get some of the details wrong, or they might get outdated, so take this with a grain of salt.
Alright! To move on, we have to understand how v8 saves JS objects in memory. Very simplified, an object looks like this:
┌────────────┐
│ Map        │
├────────────┤
│ Properties │
├────────────┤
│ Elements   │
├────────────┤
│ …          │
└────────────┘
Each one of these entries (slots) is "pointer sized", which on 64-bit system means 8 bytes.
- The Map, also called Hidden Class or Shape, is an internal data-structure which describes the object. V8 and other JS engines have a lot of internal optimizations that depend on this Shape. For example, optimized code is specialized for one or more Shapes. When you pass in an object of a different Shape, the engine will bail out to slower code.
- Properties, is a pointer to an optional hashmap, which can hold additional properties that get added later to an object. You will sometimes hear or read about "dictionary mode" objects. This is it.
- Elements is a pointer to some optional indexed properties, like for an array.
- …: And then each object can have a number of inlined properties. This is
what makes property access fast. The Map describes which properties are
inlined at which index, and optimized code will just fetch the property from
index
Xinstead of looking it up through Properties.
Each object at least has the three special properties, so each object is at
least 24 bytes. In our example, each Node is 160 bytes, so it has
20 slots, minus the special ones leaves us with up to 17 slots for
arbitrary properties. That is quite a lot.
So, what is such a Node anyway? When typescript, or any other parser
essentially, parses the source code, it creates an internal data-structure,
called the Abstract Syntax Tree (AST). And as the name says, it is a tree,
consisting of Nodes. Each syntax construct is represented by a different
type of node.
- An Identifier (
ident) for example only has to know its name. - A MemberExpression (
object.property) has references the object and the property. - An IfStatement (
if (condition) { consequent } else { alternate }) also has references to its child blocks. - … and so on …
While each one of these nodes share some common properties, like their location in the source file for example, each syntax node has very different properties. Which makes it hard for JS engines to optimize this particular data structure, and functions that work with these.
# Trying to improve things
There is one more very important detail I left out.
V8 has a lot of heuristics, and one of them is that it groups all these objects based on the constructor function. And typescript unfortunately uses a single constructor function for all of these very different node types. It is quite unlikely that every AST node will need 17 properties.
With this is mind, we can try to improve things.
For a live demo, we can just live-patch the node_modules/typescript/lib/tsc.js
file, and search for function Node(. In the typescript source tree, we find
the code here.
Surprisingly, right next to it is this thing called the objectAllocator:
(I added a prettier-ignore comments, otherwise my editor will auto-format this)
function Node(kind, pos, end) {
  this.pos = pos;
  this.end = end;
  this.kind = kind;
  this.id = 0;
  this.flags = 0;
  this.modifierFlagsCache = 0;
  this.transformFlags = 0;
  this.parent = undefined;
  this.original = undefined;
}
// [… snip …]
// prettier-ignore
ts.objectAllocator = {
  getNodeConstructor: function () { return Node; },
  getTokenConstructor: function () { return Node; },
  getIdentifierConstructor: function () { return Node; },
  getSourceFileConstructor: function () { return Node; },
  getSymbolConstructor: function () { return Symbol; },
  getTypeConstructor: function () { return Type; },
  getSignatureConstructor: function () { return Signature; },
  getSourceMapSourceConstructor: function () { return SourceMapSource; },
};
So apparently, TypeScript already has all the necessary infrastructure in place
to at least split the Nodes into four categories. Also note that it uses the
same constructor function for SourceFiles, which are very different from
AST Nodes.
So just for fun, lets copy-paste this Node function, rename it, and use it for
all of these different types…
With this trivial change done, lets try running tsc again:
Memory used: 353732K
Scrolling back up, and running these commands a few more times, the numbers are very reproducible. Our memory usage went from 375M to 353M. We just saved ourselves 22M of memory usage, which amounts to roughly ~6%.
Lets double-check using the memory profiler.
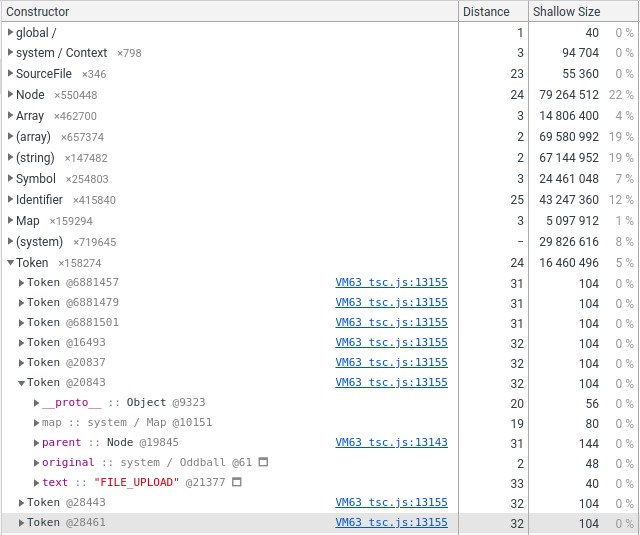
In the end, we end up with these sizes:
| Type | Size (bytes) | Frequency |
|---|---|---|
| SourceFile | 160 | ~0% |
| Identifier | 104 | ~37% |
| Token | 104 | ~13% |
| Node | 144 | ~50% |
What we see from this is that mixing SourceFile with all the rest of the
Nodes is not a really good idea. Also, 104 bytes equals 10 non-special
properties, which is a lot for things like Tokens, which are usually
punctuation, but TS uses them for literals, or Identifiers,
which just represent one word in the source text.
Careful analysis could further shrink the memory usage, by removing unused
properties, or further splitting up and organizing the different token types.
# Bad news
While I only write about this in early January, I did all the analysis and patching in mid September last year. You can check the pull request on the typescript repo; it is still open as I write this blog. :-( When running typescripts own performance test suite, my patch demonstrated a 6~8% decrease in memory usage, so even more significant than the saving demonstrated with the testcase here. But there is apparently no interest from the maintainers to merge it. I asked again early December, one month ago, to get some feedback, but got no reply whatsoever. Compared to my first PR , which was merged in less than 24 hours, this is super disappointing and frustrating for an external contributor. So if anyone has any connections to the maintainers, please kick some ass to get some progress here. :-)
The other thing is aws-sdk, which I used as the testcase here.
One thing people could do it to better organize their library, for example by
bundling both library code and their types. And it just so happens that I
maintain rollup-plugin-dts
which you should definitely check out :-)
But introducing bundling after the fact might be a breaking change for library
users, so I understand its not always feasible.
BUT, after some digging around, I found out that the aws-sdk actually has
more focused imports, so instead of import { S3 } from "aws-sdk", one can do
import S3 from "aws-sdk/clients/s3" (one reason why bundling would break things).
You might want to use such focused imports to save both startup time and memory
usage at runtime. I haven’t checked what the runtime code actually does, but
the type definitions end up including the whole world, even though you would
like to use focused imports.
I created an issue, also in
September, which got a single comment along the lines of
"we don’t really care, wait for the next major version", which is also quite
disappointing. I don’t have such a deep insight, but I would guess that a fix
for this would be quite simple; especially since aws-sdk has a ton of
duplicated type aliases.
# Conclusion
Memory optimization is hard, especially in JS. Also, parsers and compilers are
even harder to optimize in JS. It is amazing that something like an Identifier,
which in minified code is only 1 character = 1 byte, is blown up to
160 bytes by parsing it into a data structure that a compiler can work with.
Profiling JS is a complex thing to do. Engines have a ton of optimizations and heuristics. They try to be very smart. They mostly succeed, but there are some code patterns that are very hard to optimize. Figuring out what is really happening requires a lot experience, knowledge, guessing, and sometimes just luck. I hope I have opened the eyes of some by showing how I approach these kinds of problems.
One recommendation for other developers, that you can also read and hear about a lot is to use constructor functions, which initialize all the properties that an object can have, with correct types. Just putting random properties on objects at random times, like typescript apparently does is really bad for performance.
But in the end, the number one rule is to: measure, measure, measure! and then measure some more!